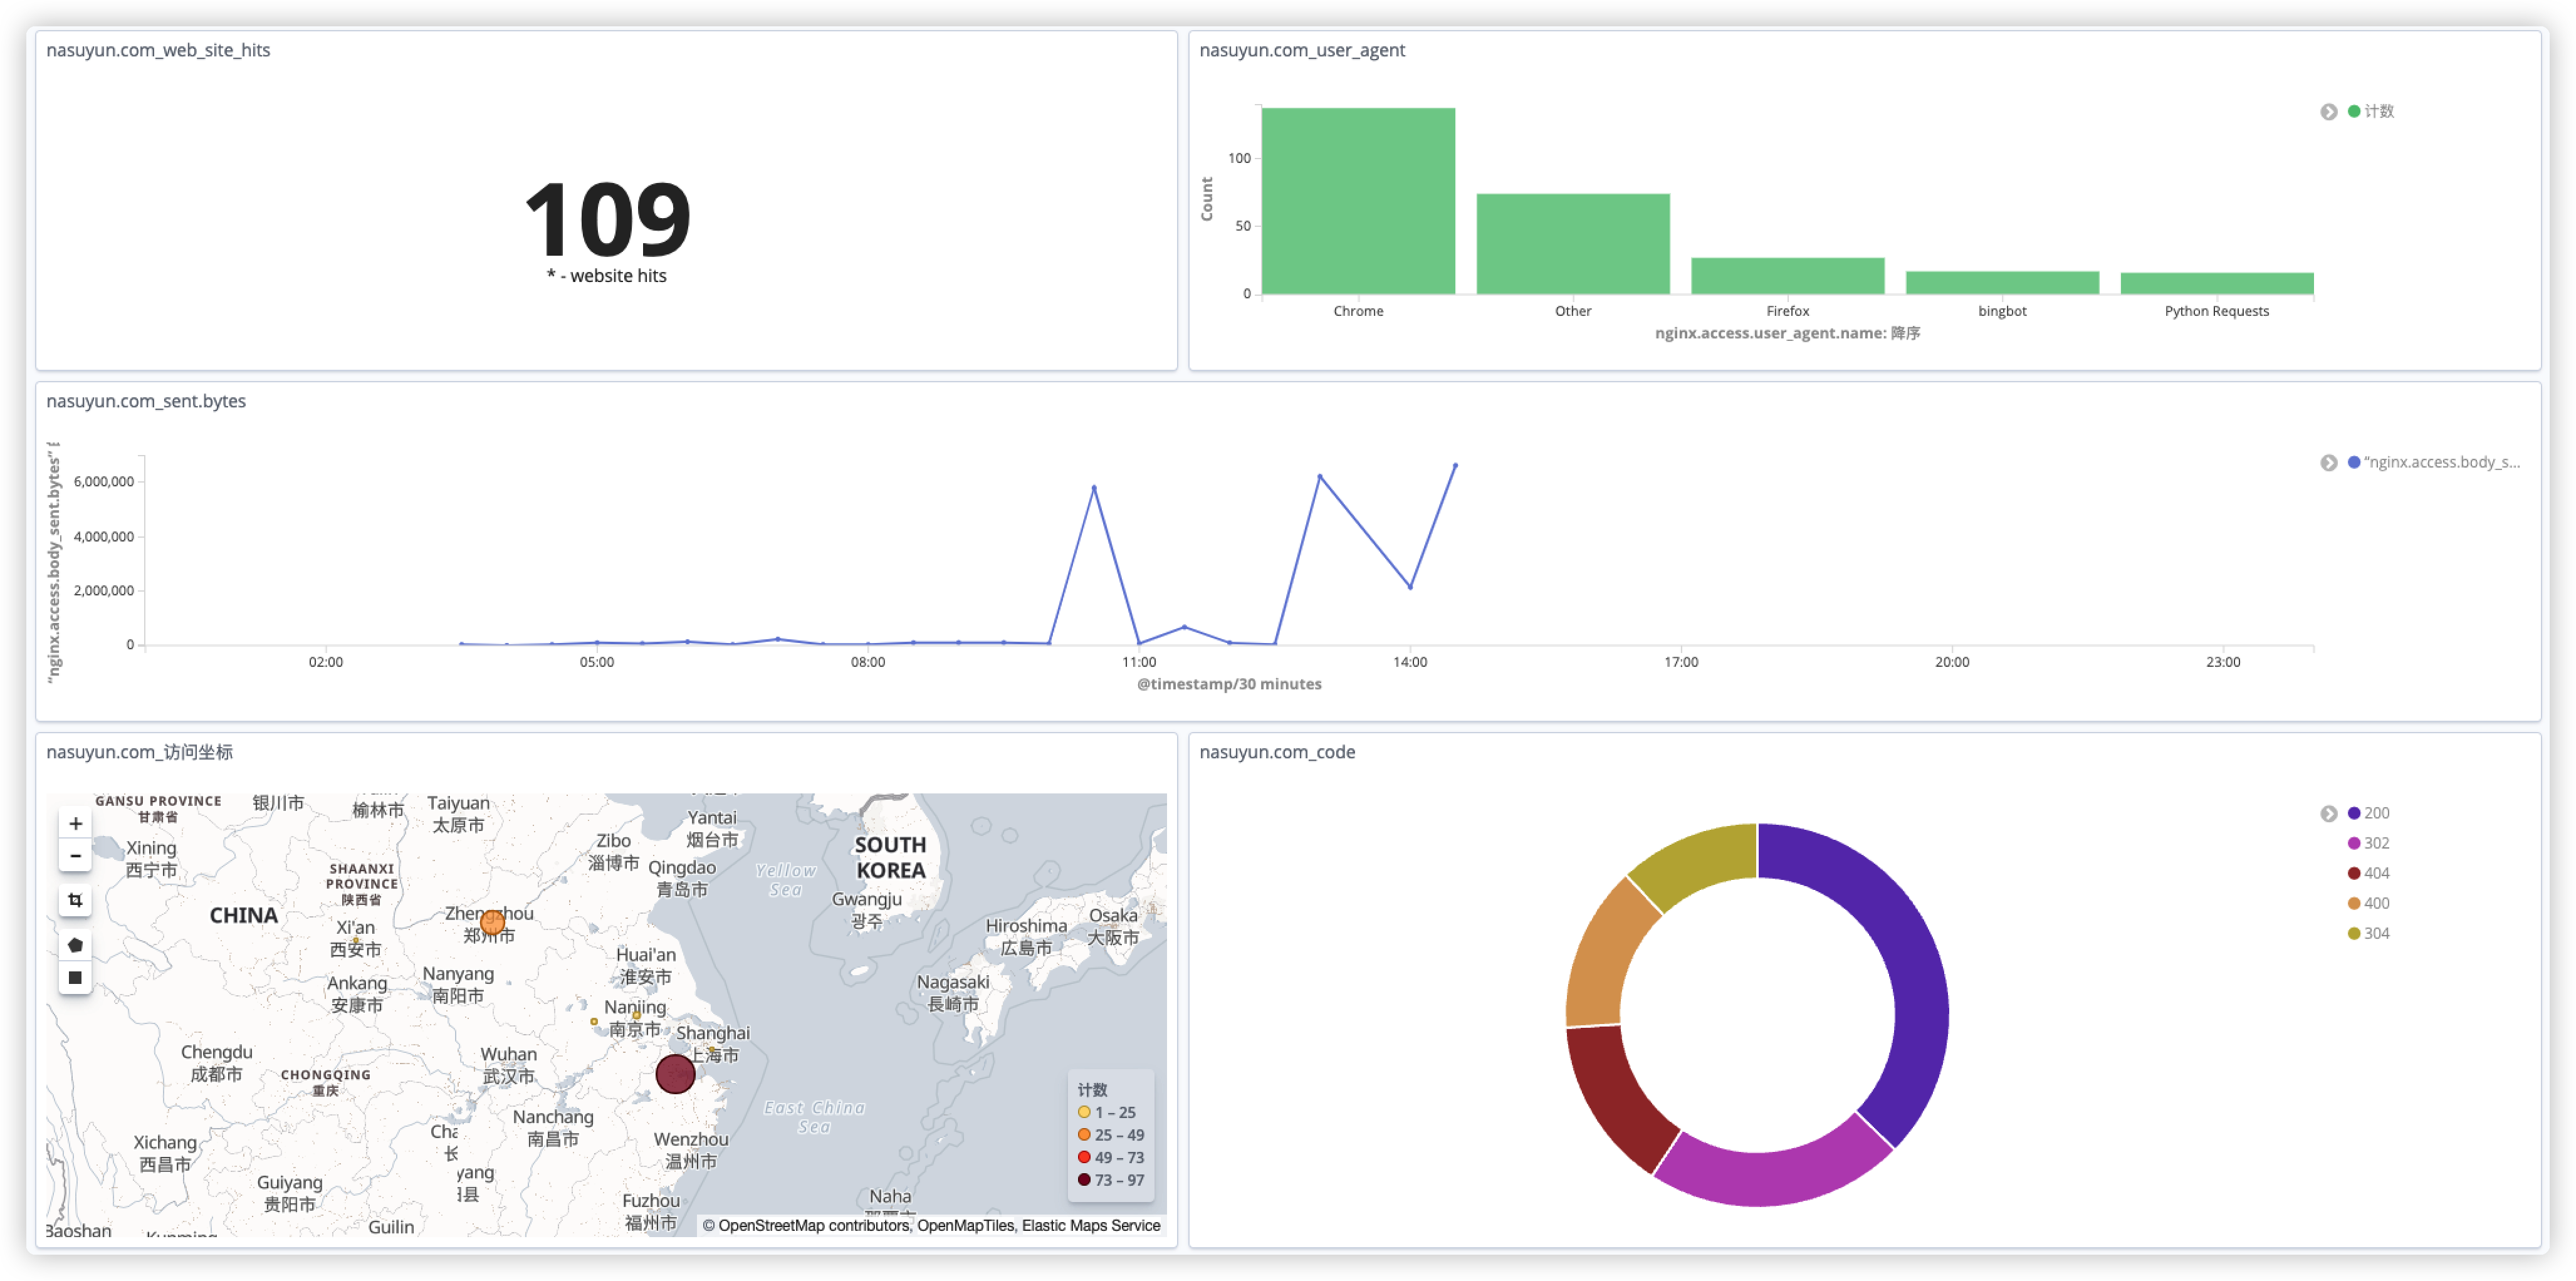
概览
在本实战教程中,演示如何使用 Filebeat + Nasu Elasticsearch Serverless + Kibana 搭建基础的 Nginx 日志分析框架。 通过该教程你将掌握以下技能:
- 利用 FileBeat(轻量级的日志采集工具)收集日志数据。
- 利用 Nasu Dashboard Pipeline Tools 进行数据加工。
- 利用 Kibana 搭建仪表板构造可视化展示。
准备
前往 纳速云控制台 创建 Elasticsearch Serverless 应用, 5秒内可为你部署好 ES 和 KIBANA ,省去复杂的自建流程。
数据采集篇
登录我们的Web服务器,查看nginx产生的日志,默认的nginx日志格式,文件内容通常长这样:
IP地址 - - [22/Oct/2022:15:09:08 +0800] "GET / HTTP/1.1" 200 32943 "http:/xxx.xxx.xxx.xxx/" "Mozilla/5.0 (Macintosh; Intel Mac OS X 10_7_0) AppleWebKit/535.11 (KHTML, like Gecko) Chrome/17.0.963.56 Safari/535.11" "-"
IP地址 - - [22/Oct/2022:15:09:33 +0800] "GET /robots.txt HTTP/1.1" 302 145 "-" "Go-http-client/1.1" "-"
IP地址 - - [22/Oct/2022:15:09:42 +0800] "GET /robots.txt HTTP/1.1" 404 1540 "http://xxx.xxx.xxx.xxx/robots.txt" "Go-http-client/1.1" "-"
IP地址 - - [22/Oct/2022:15:09:44 +0800] "GET /sitemap.xml HTTP/1.1" 302 145 "-" "Go-http-client/1.1" "-"
IP地址 - - [22/Oct/2022:15:26:32 +0800] "GET / HTTP/1.1" 302 145 "-" "Mozilla/5.0 (Windows NT 6.1; Win64; x64) AppleWebKit/537.36 (KHTML, like Gecko) Chrome/106.0.0.0 Safari/537.36" "-"
首先将该web服务器的IP地址添加至应用白名单内,确认网络层打通。
# 查看外网IP
curl ip.gs
下载 filebeat
curl -L -O https://ebase.oss-cn-shanghai.aliyuncs.com/downloads/v6.8.23/filebeat_oss/filebeat-oss-6.8.23-linux-x86_64.tar.gz
tar -zxvf filebeat-oss-6.8.23-linux-x86_64.tar.gz
cd filebeat-6.8.23-linux-x86_64
配置 filebeat.yaml
# 配置 filebeat.yaml 连接到纳速云端 Elasticsearch
filebeat.inputs:
- type: log
  enabled: true
  paths:
    - /var/log/nginx/access*.log
output.elasticsearch:
  hosts: ["router.nasuyun.com:9200"]
  protocol: "https"
  username: "youre_app_username"
  password: "youre_app_password"
启动 filebeat
./filebeat
如无意外,filebeat 将日志采集至云上ES,进入控制台通过数据集查看 filebeat* 类的索引
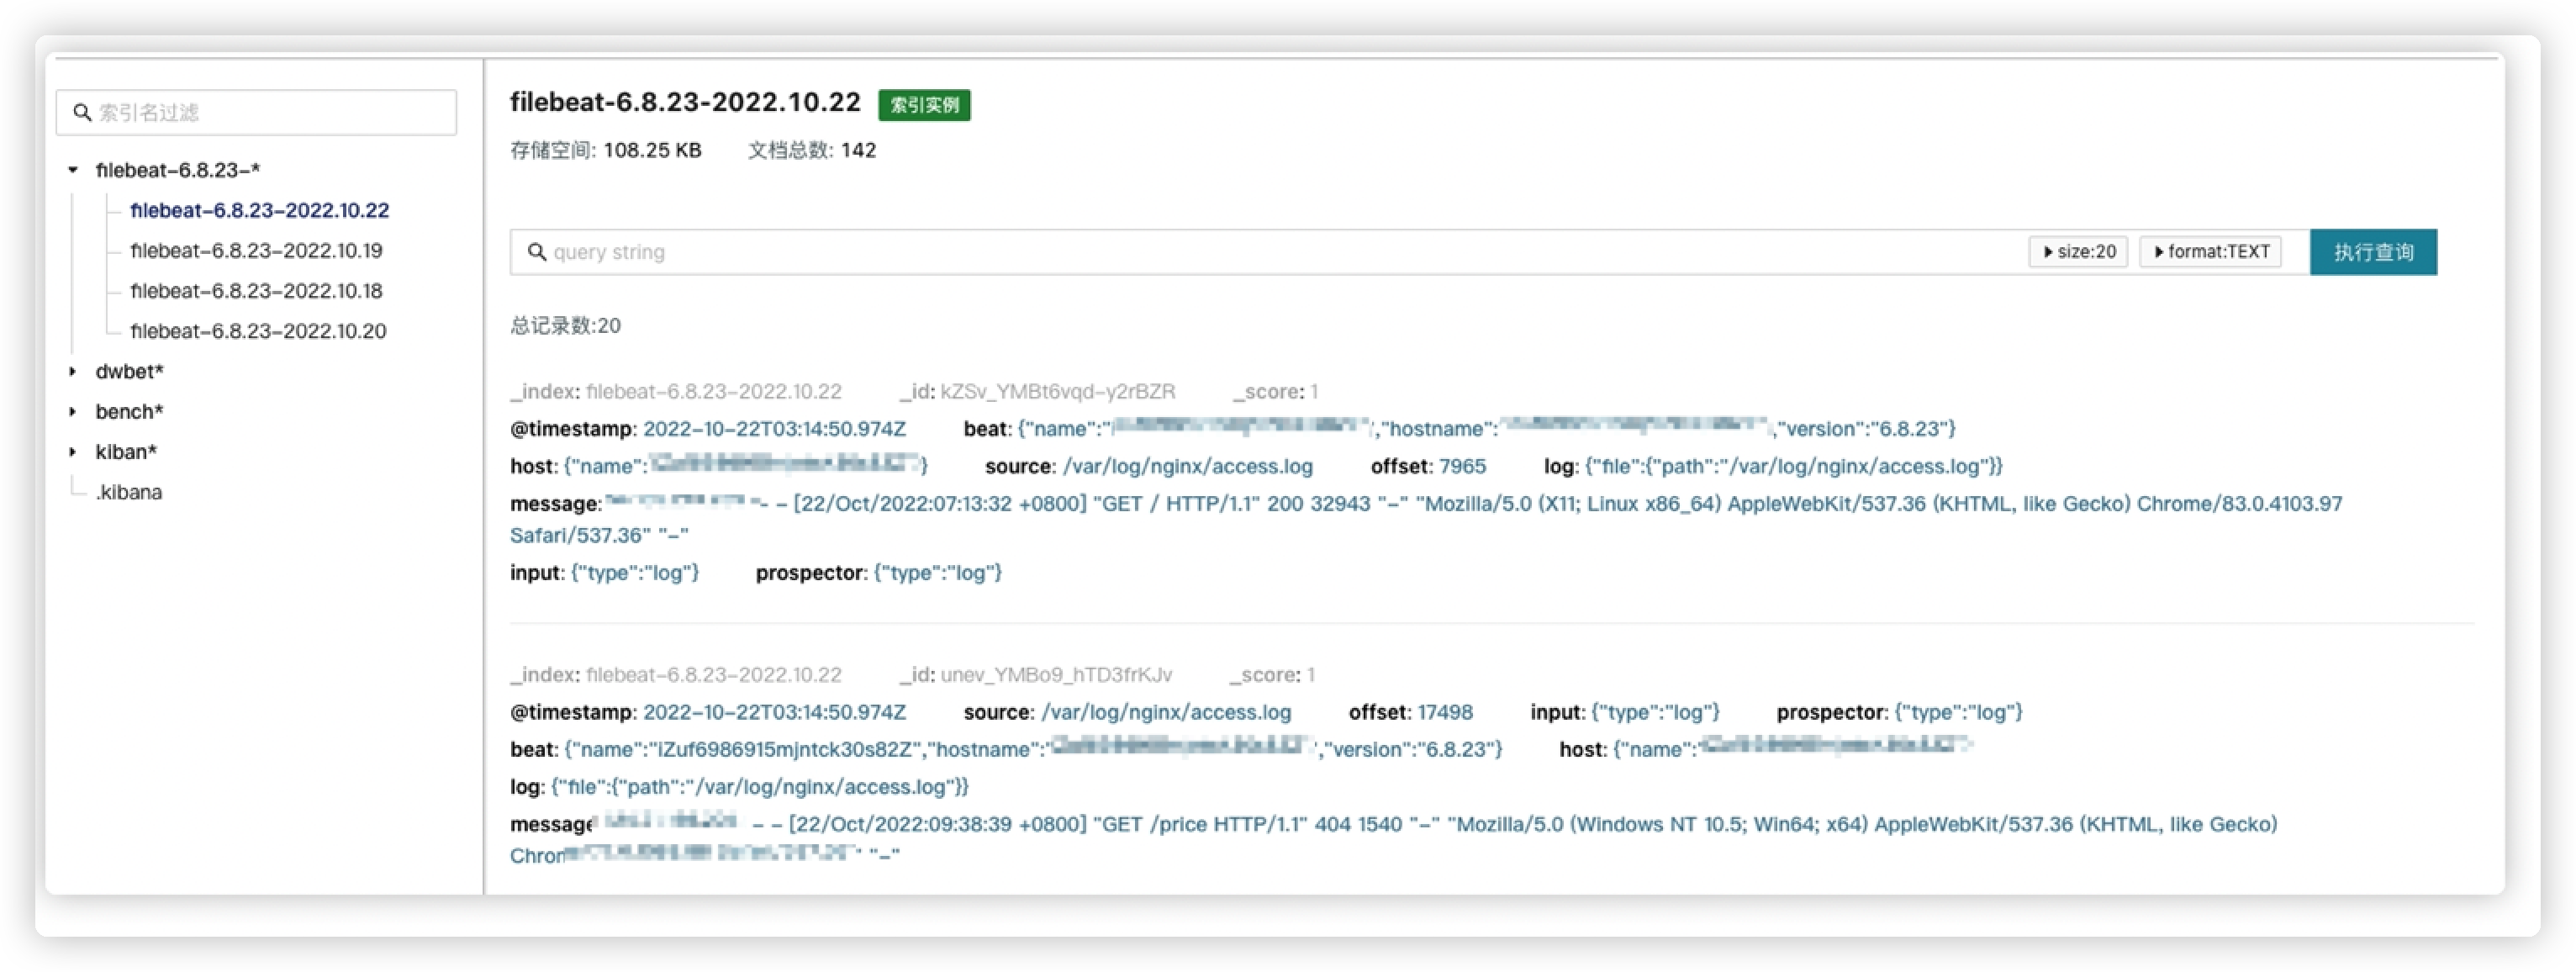
此时,filebeat 将采集到的日志内容全部保存在 message 字段中,仅适用于日志检索场景, 为了更好的分析,我们可以使用云端数据加工将内容进行转换,例如提取IP字段分析访问来源,提取流量字段等。
数据处理篇
前往控制台 - 数据加工
「数据加工」具备样本数据检索、模拟调试以及大量的预制模板,方便您快速构调试数据处理脚本。
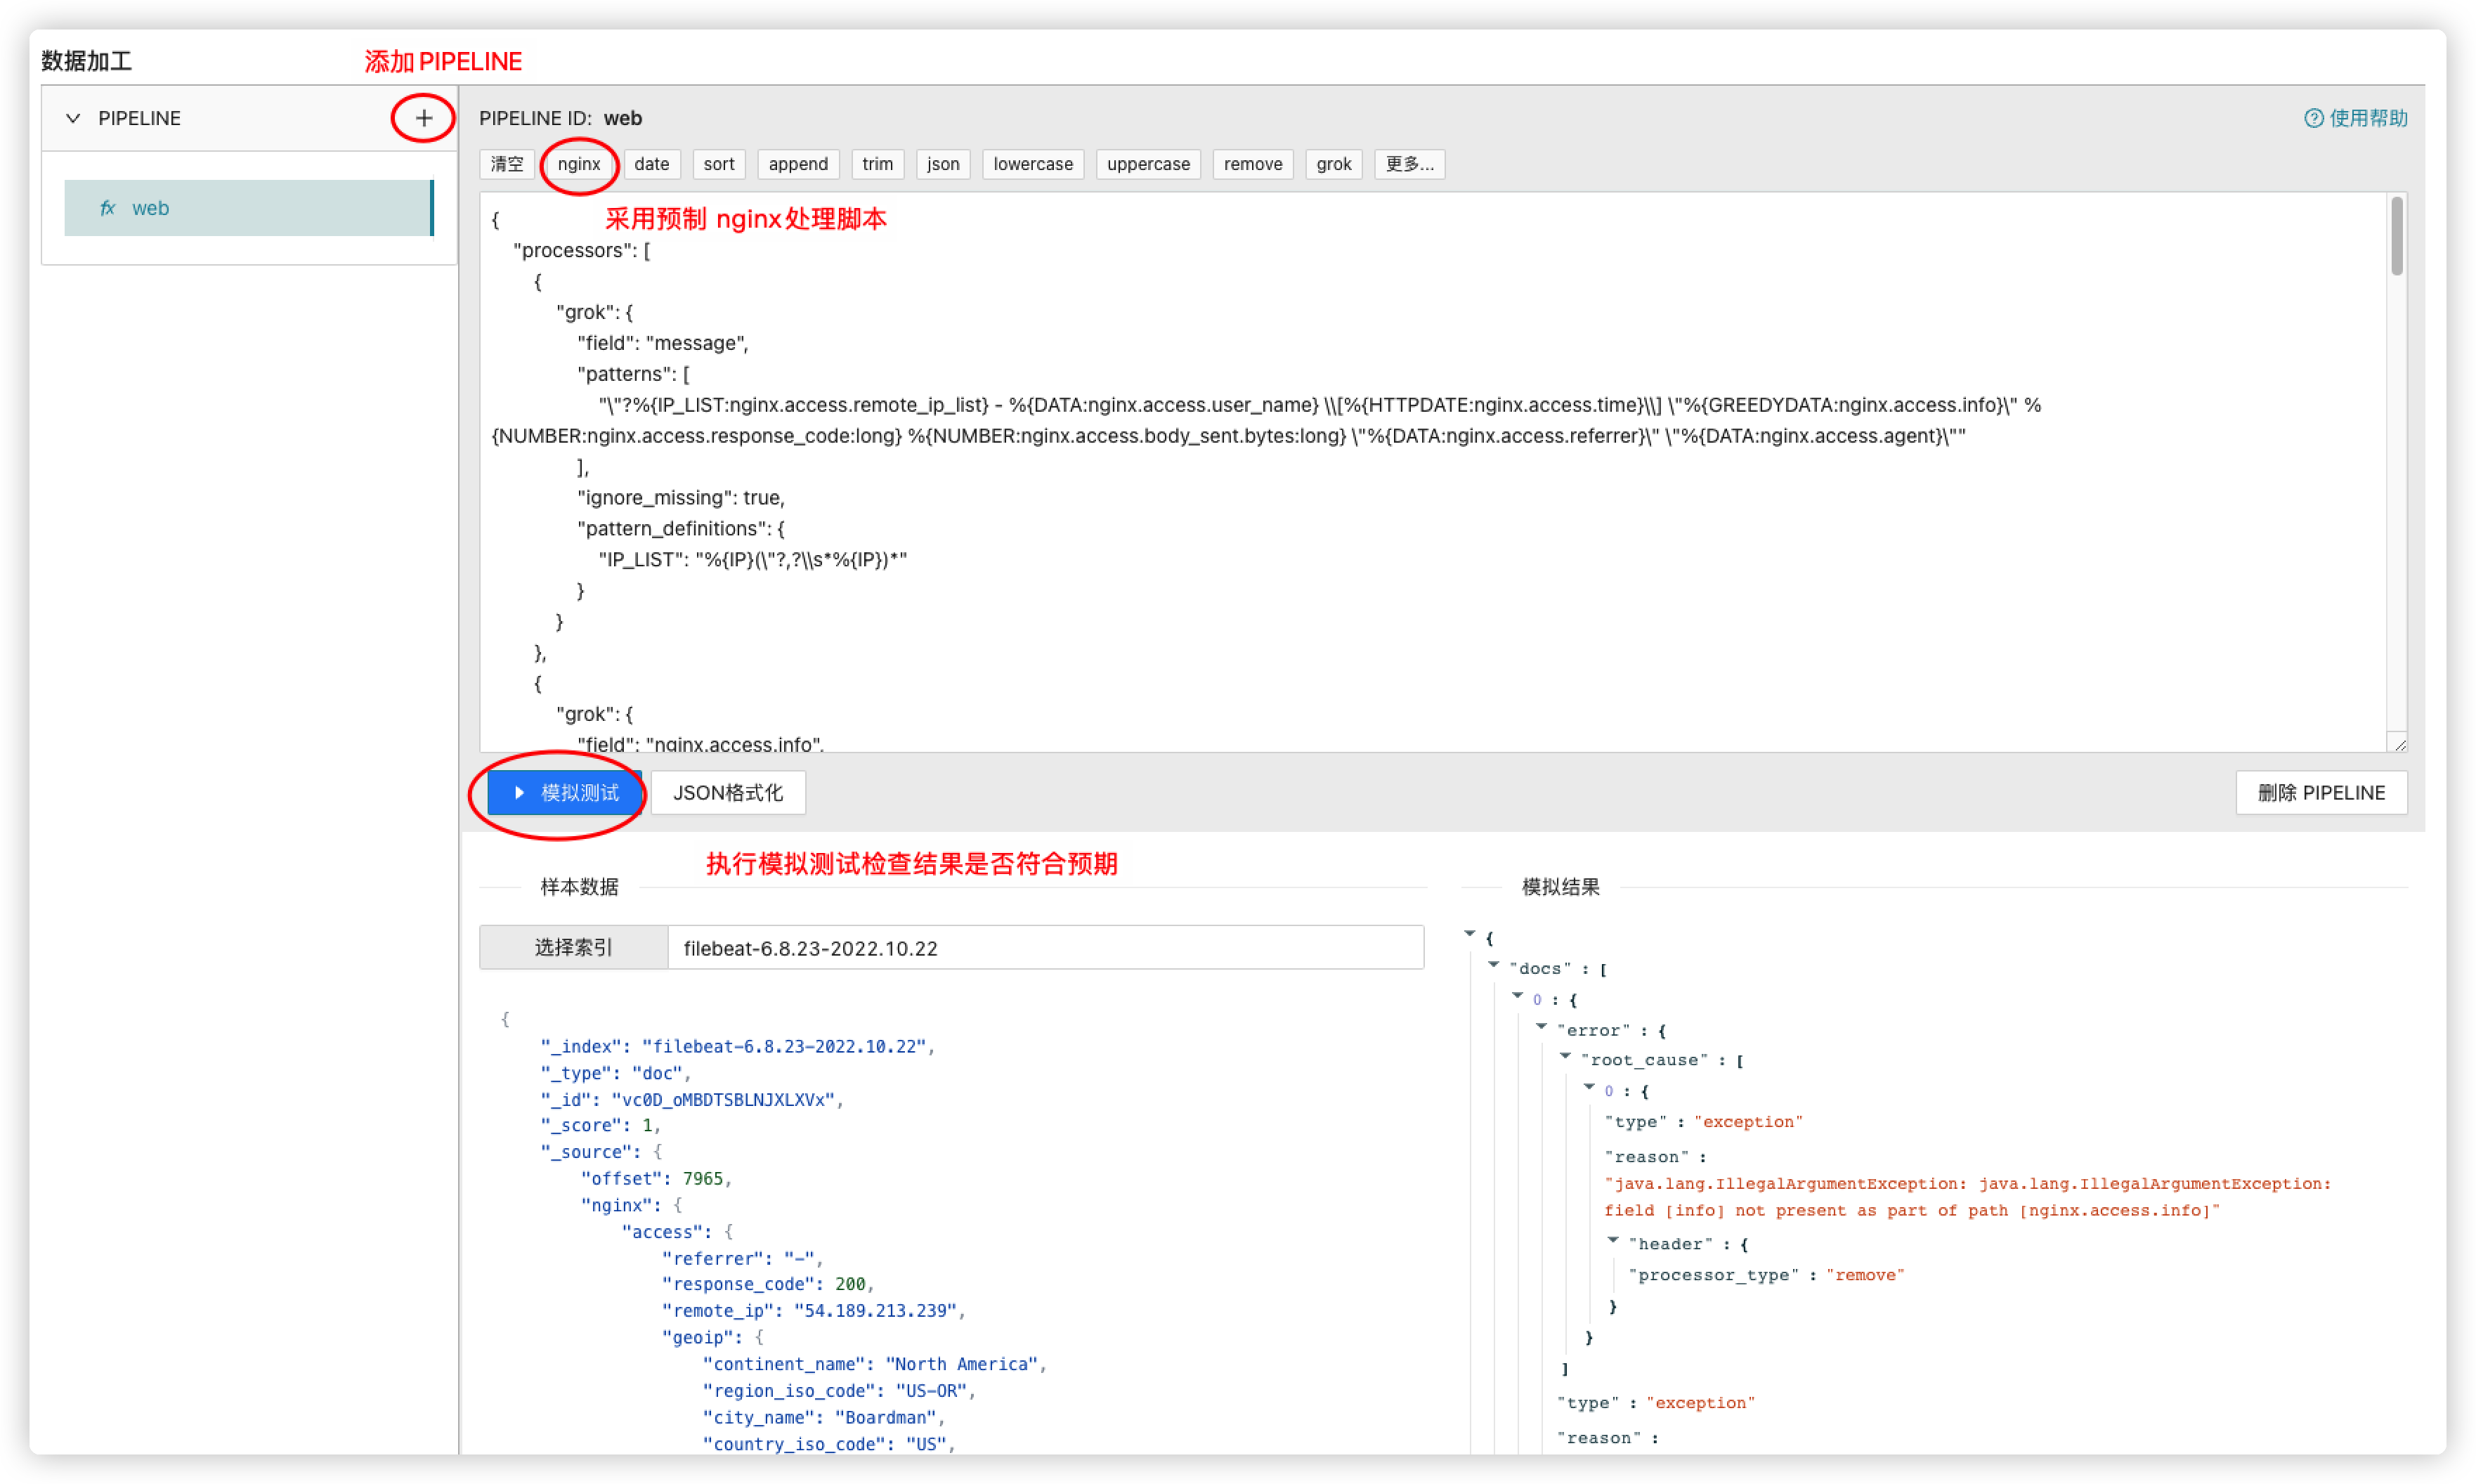
如果日志为nginx标准格式,可采用预制的nginx模板, 这里保存名为 web 的pipeline, 并在filebeat中指定该 pipeline
output.elasticsearch:
  hosts: ["router.nasuyun.com:9200"]
  protocol: "https"
  username: "youre_app_username"
  password: "youre_app_password"
  pipeline: "web"
重启 filebeat , filebeat 新采集的数据将通过 pipeline 处理为新的索引数据格式。
数据展示篇
接下来,我们在云端 Kibana 进行网站分析的具体操作。我们将设置以下常见的可视化仪表板,帮助我们了解网站的运行情况。
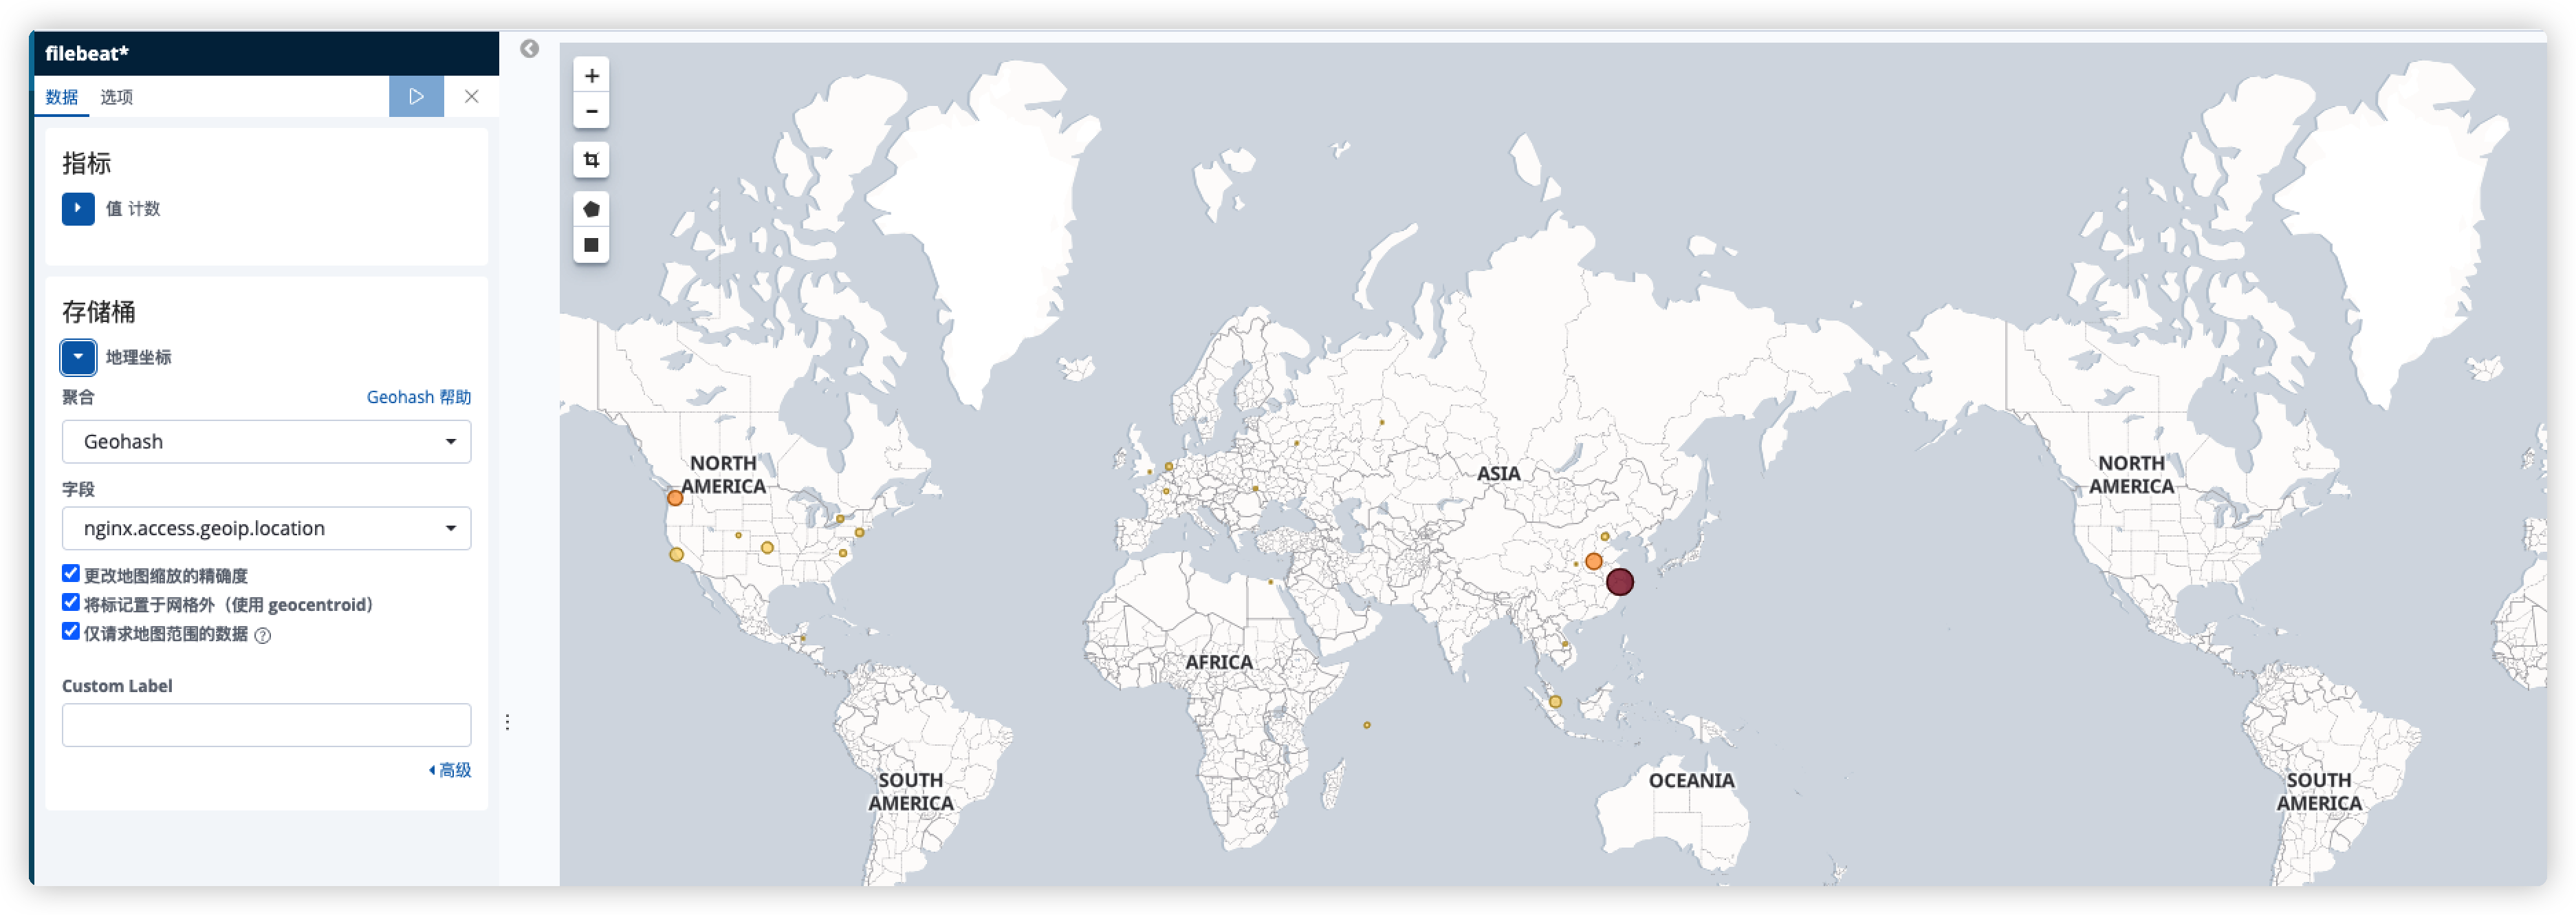
- 从地理地图查看人们从哪里访问
- 网站点击计数器
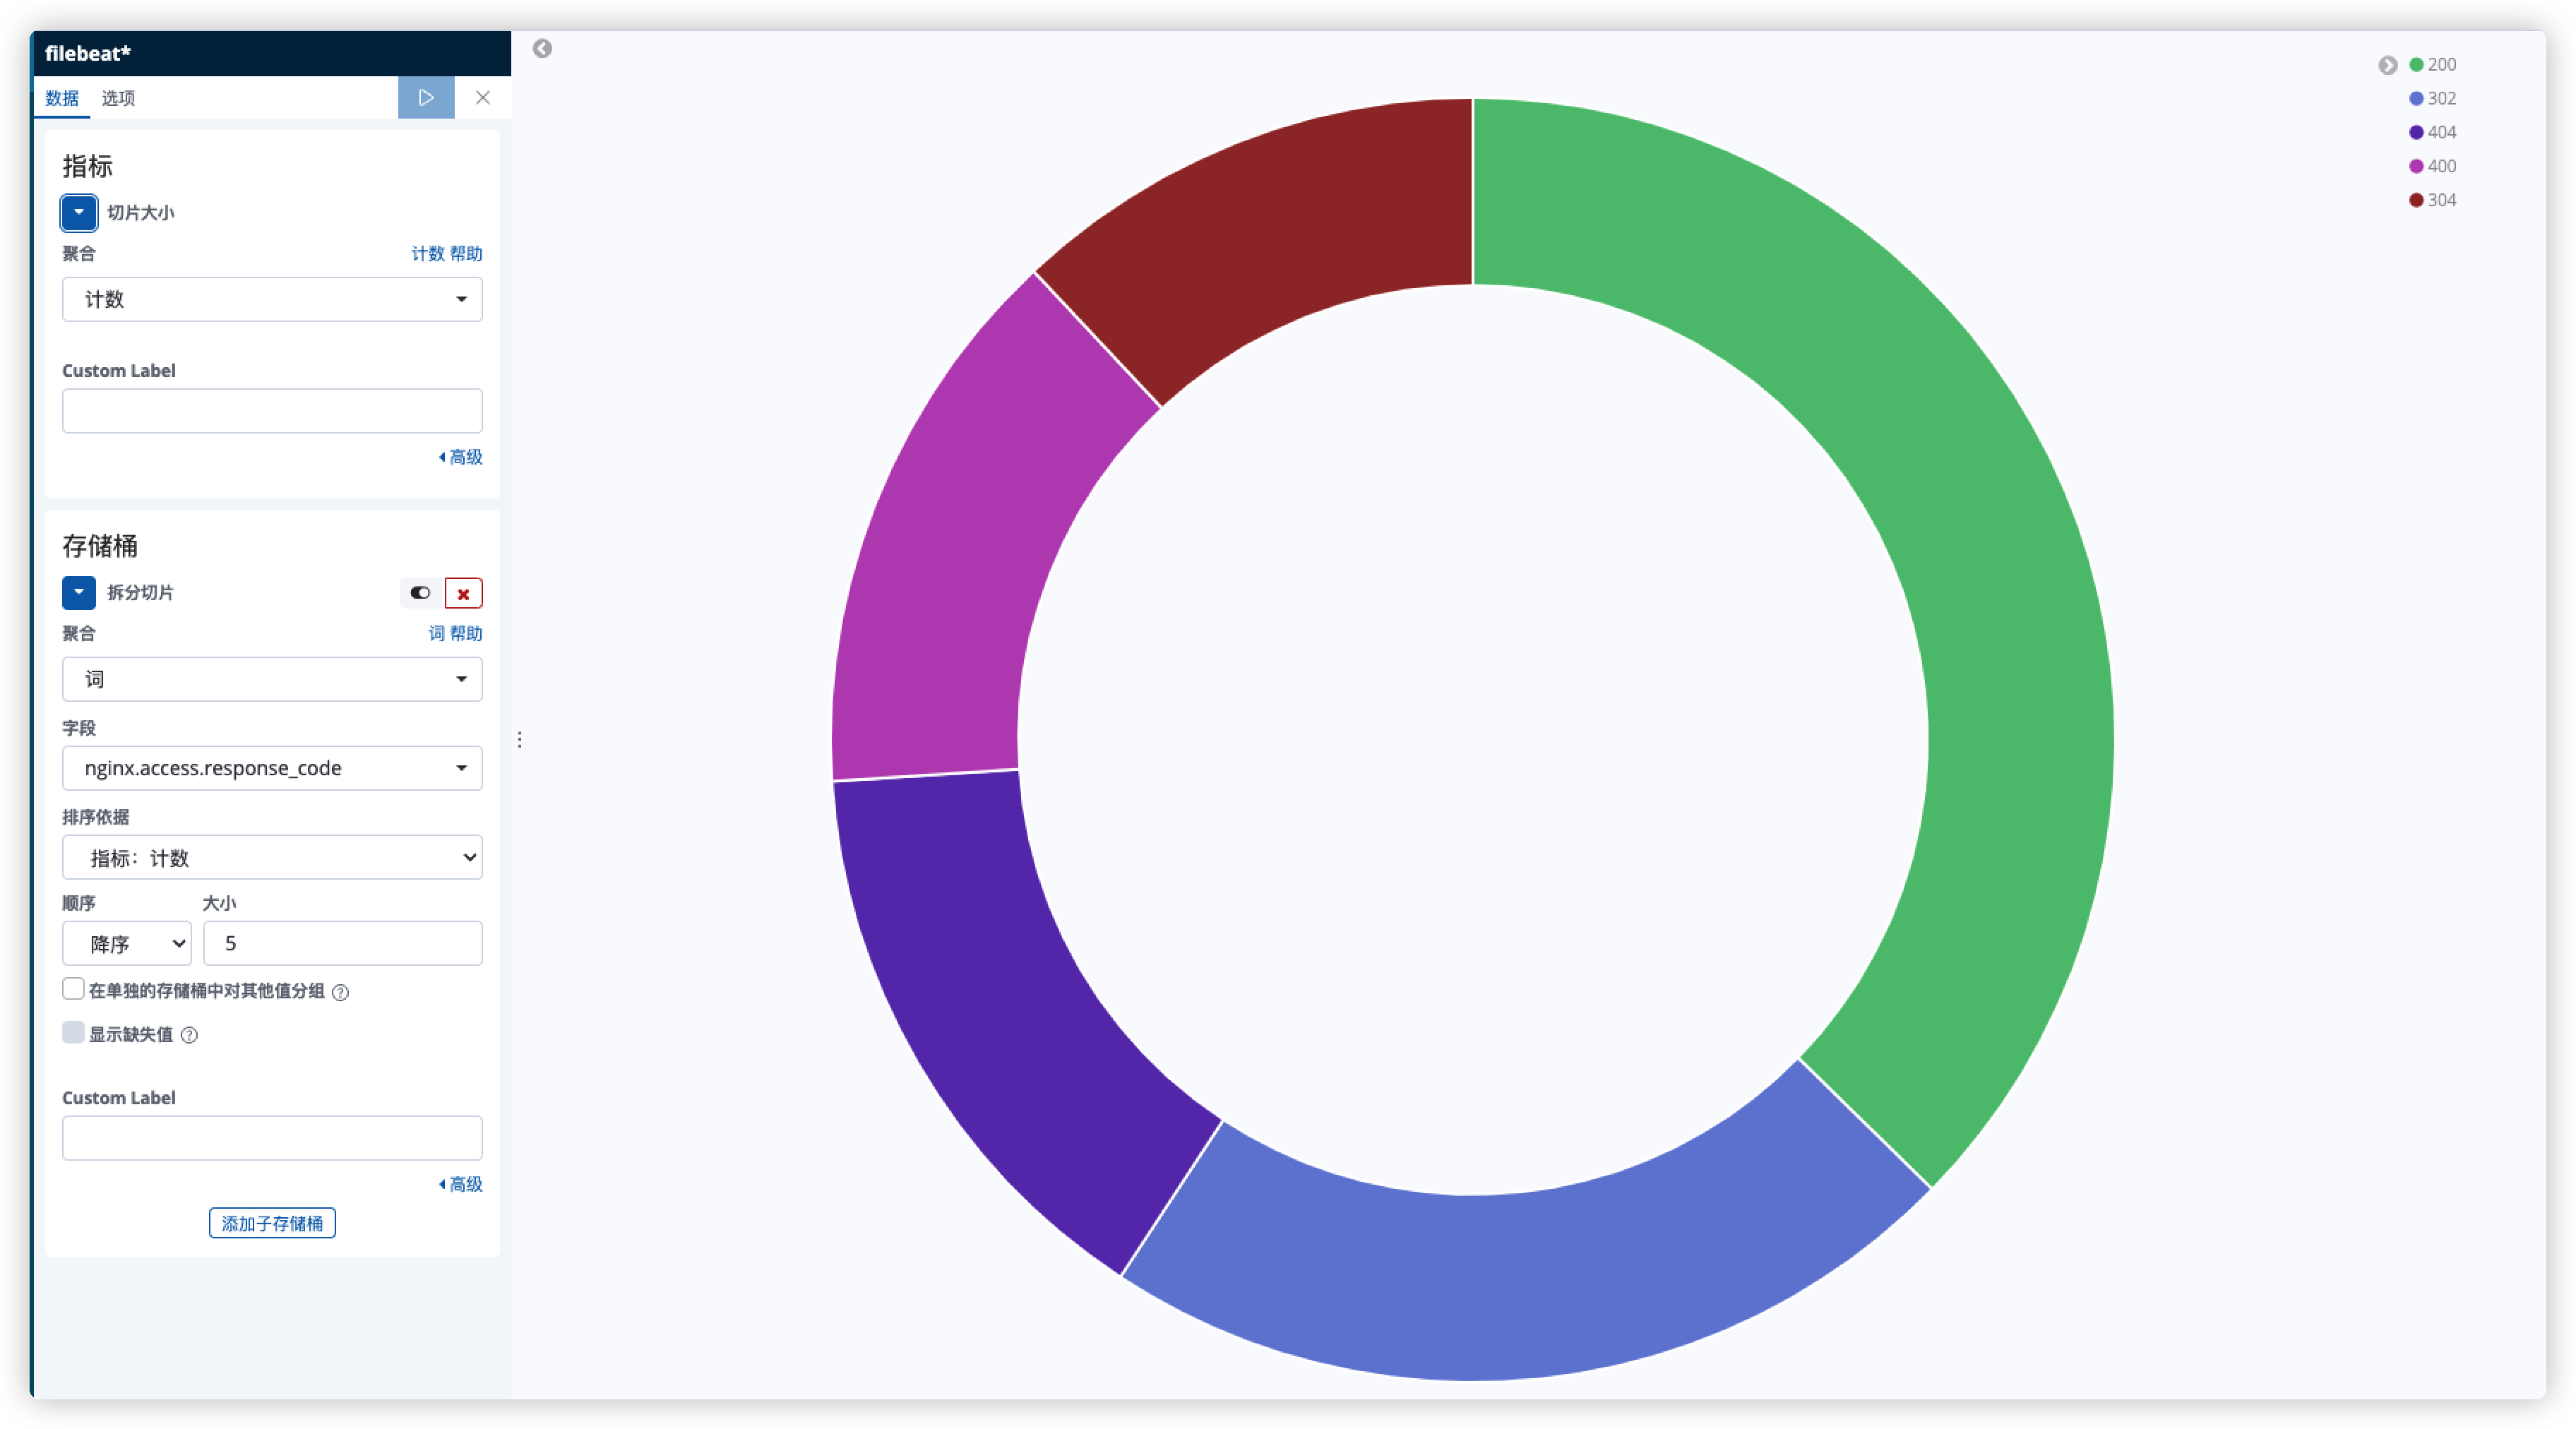
- 前 5 个 HTTP 状态分布
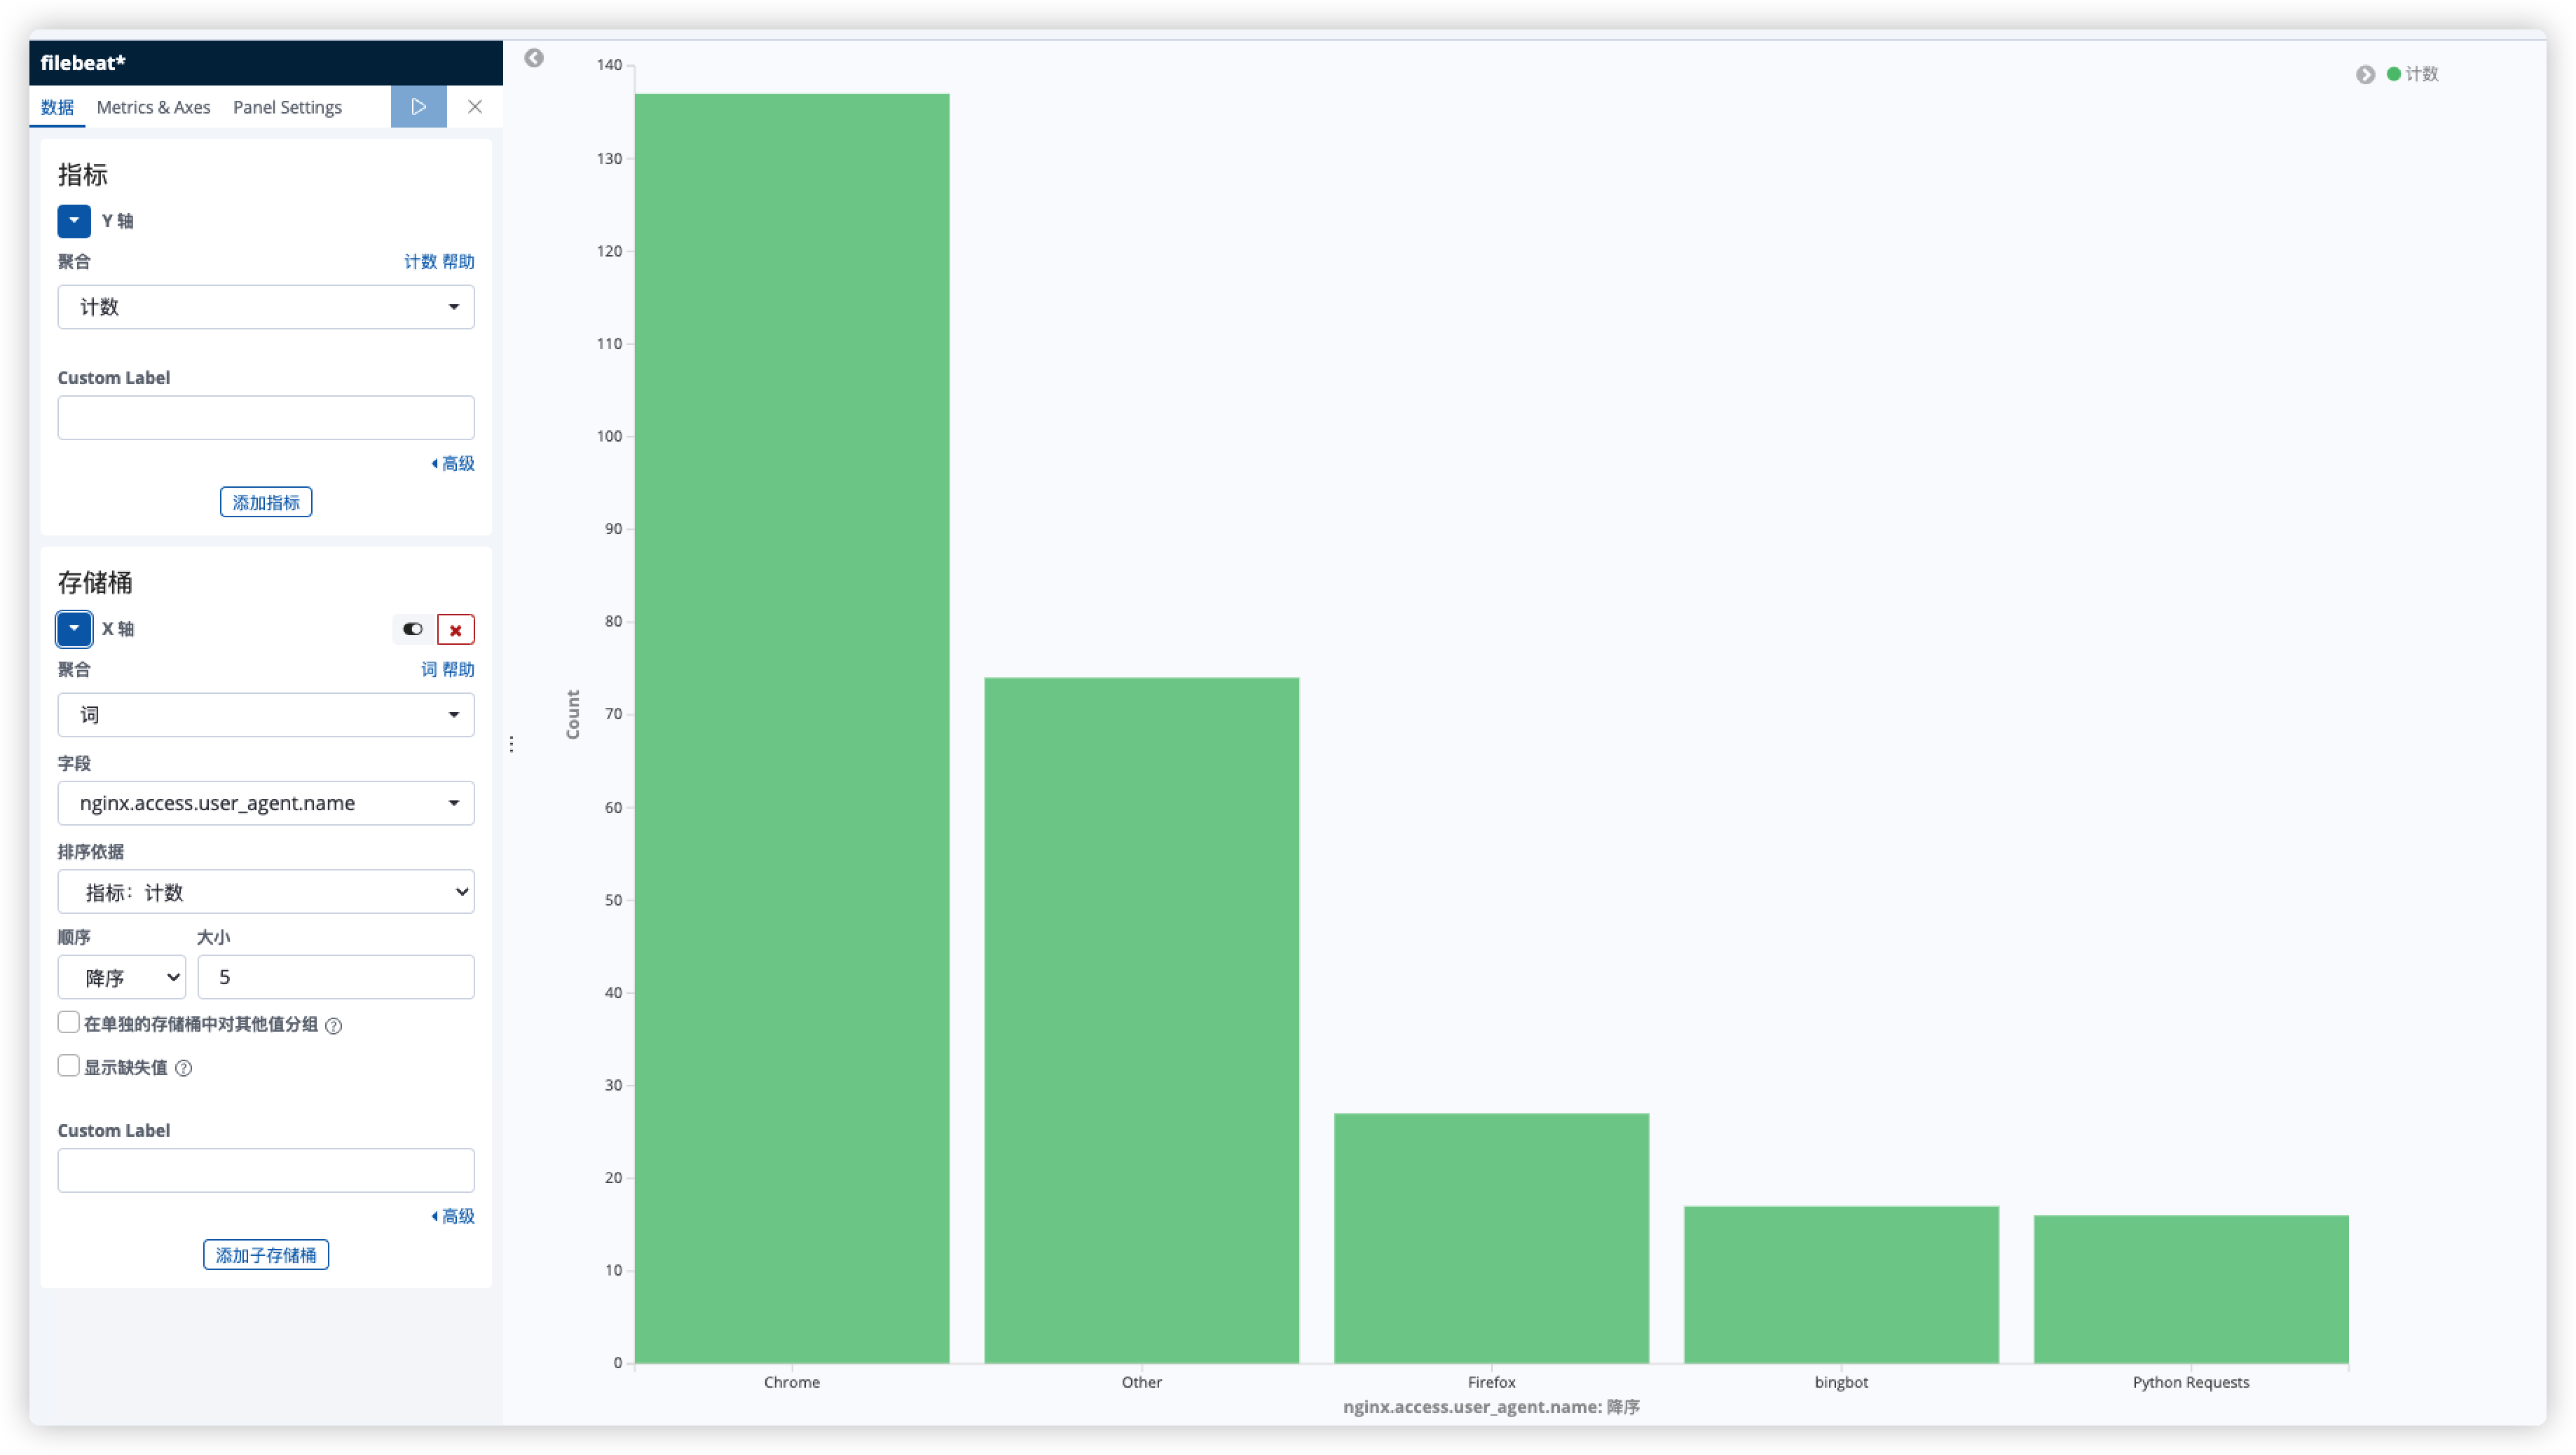
- 访问浏览器类型(User-Agent)
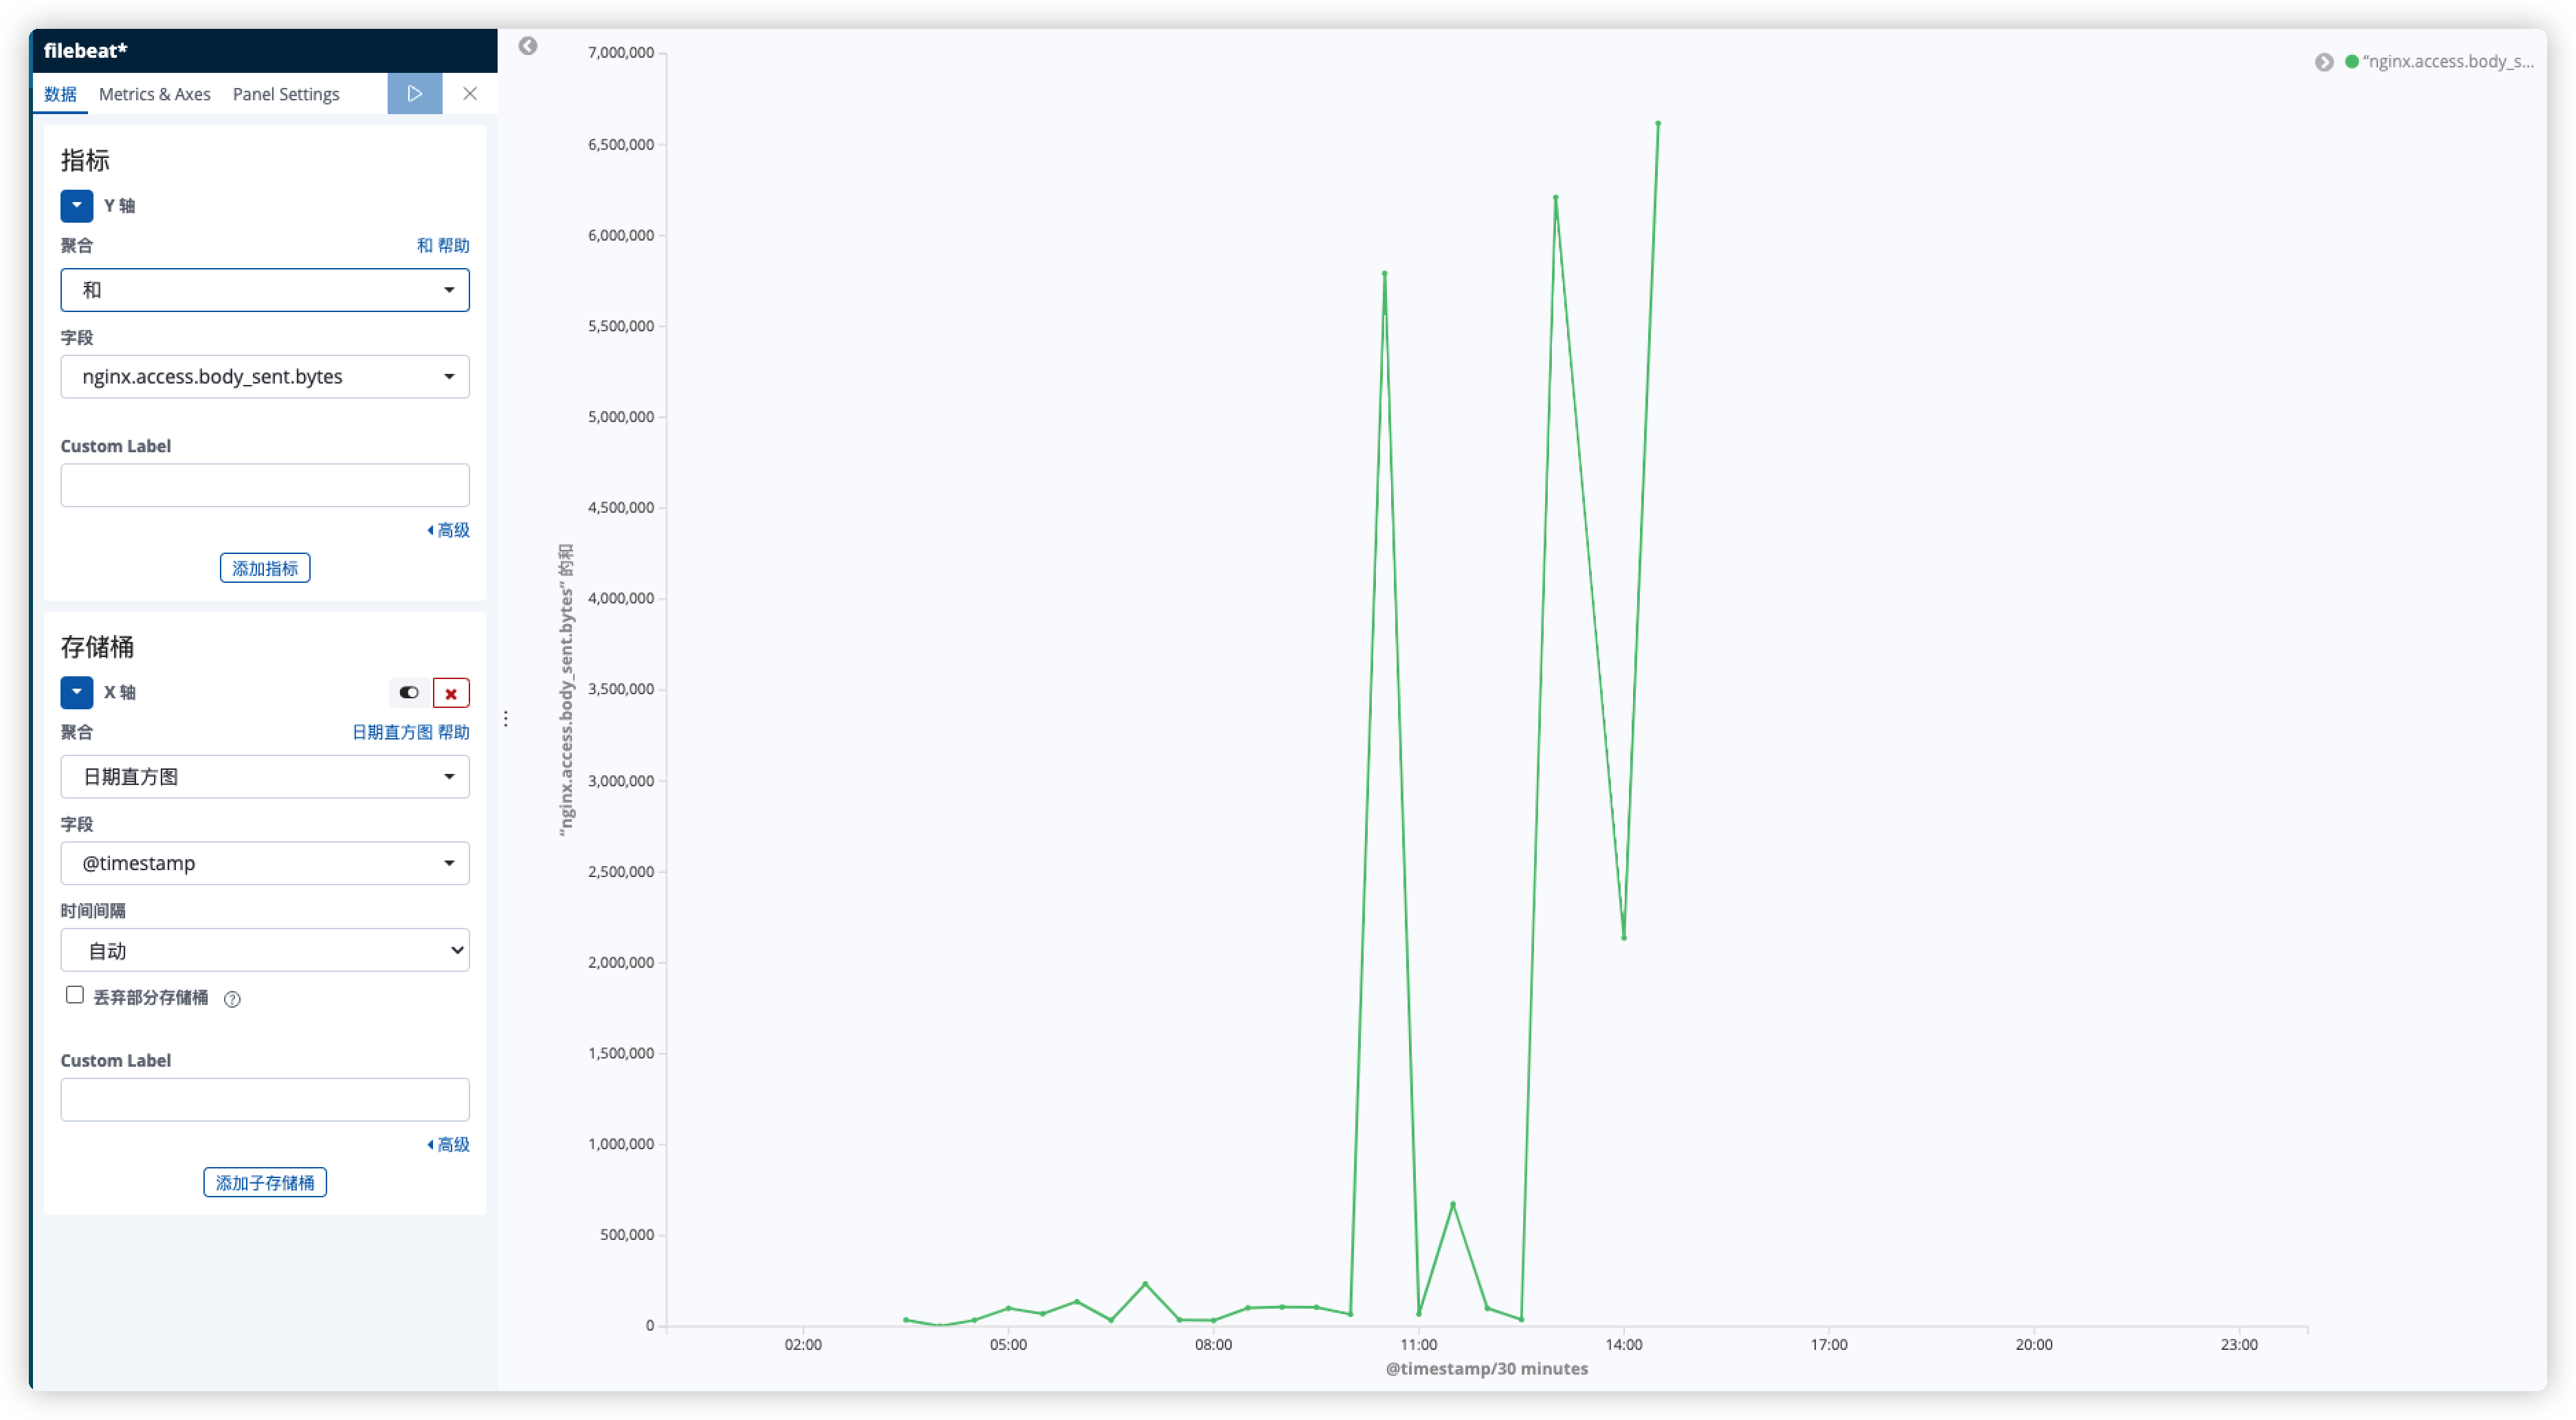
- 网站返回字节
在可视化中添加坐标地图,展示访问来源
采用饼图分析 HTTP_STATUS_CODE 占比
柱状图分析 客户端 User-Agent
折线图分析 响应流量
将可视化组件组成仪表板

这是一个基础的仪表板,但它足以让您亲自动手并构建一些很棒的可视化面板。
